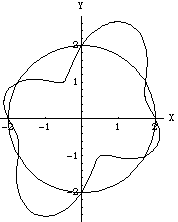
For Mathematica Lab 1, use PolarPlot for question 1. Sample use:
<< Graphics`Graphics`
PolarPlot[{2, 2 - Cos[3t]Sin[t]}, {t, 0, 2Pi}, AxesLabel -> {X, Y}]

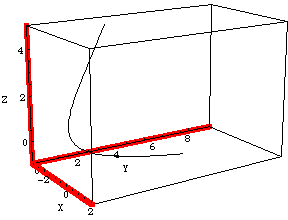
For question 2, use ParametricPlot3D. Sample uses:
ParametricPlot3D[{t, t^2, Exp[-t]}, {t, -3, 2}, AxesLabel -> {X, Y, Z},
AxesStyle -> {RGBColor[1, 0, 0], Thickness[0.02]},
AxesEdge -> {{-1, -1}, {-1, -1}, {-1, -1}},
ViewPoint -> {3, -2, 1},
PlotRange -> {-1, 5}]
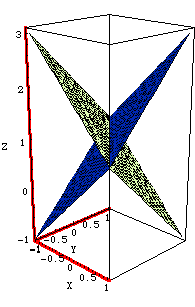
ParametricPlot3D[{{x, y, 1 - x - y}, {x, y, 1 + x + y}}, {x, -1, 1}, {y, -1,
1}, AxesLabel -> {X, Y, Z},
AxesStyle -> {RGBColor[1, 0, 0], Thickness[0.02]},
AxesEdge -> {{-1, -1}, {-1, -1}, {-1, -1}},
ViewPoint -> {2, -2, 1}]
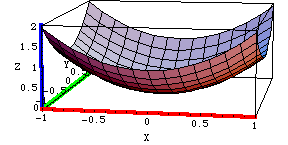
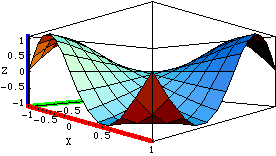
There are many options you can use with Plot3D and ParametricPlot3D. In the picture below, the commands AxesLabel gives each axis a name; the command AxesStyle gives a different color to each axis, AxesEdge determines which edge of the box surrounding the figure will be the axis, and ViewPoint determines the angle of the viewer.
Plot3D[x^2 + y^2, {x, -1, 1}, {y, -1, 1}, AxesLabel -> {X, Y, Z},
AxesStyle -> {{RGBColor[1, 0, 0], Thickness[0.02]}, {RGBColor[0, 1, 0],
Thickness[0.02]}, {RGBColor[0, 0, 1], Thickness[0.02]}},
AxesEdge -> {{-1, -1}, {-1, -1}, {-1, -1}},
ViewPoint -> {1, -6, 1}]
Plot3D[Sin[Pi x y], {x, -1, 1}, {y, -1, 1}, AxesLabel -> {X, Y, Z},
AxesStyle -> {{RGBColor[1, 0, 0], Thickness[0.02]}, {RGBColor[0, 1, 0],
Thickness[0.02]}, {RGBColor[0, 0, 1], Thickness[0.02]}},
AxesEdge -> {{-1, -1}, {-1, -1}, {-1, -1}},
ViewPoint -> {1, -1, 0}]
To learn more about the commands, type
Options[Plot3D]
You will get the list:
{AmbientLight -> GrayLevel[0], AspectRatio -> Automatic, Axes -> True,
AxesEdge -> Automatic, AxesLabel -> None, AxesStyle -> Automatic,
Background -> Automatic, Boxed -> True, BoxRatios -> {1, 1, 0.4},
BoxStyle -> Automatic, ClipFill -> Automatic, ColorFunction -> Automatic,
ColorFunctionScaling -> True, ColorOutput -> Automatic, Compiled -> True,
DefaultColor -> Automatic, Epilog -> {}, FaceGrids -> None,
HiddenSurface -> True, ImageSize -> Automatic, Lighting -> True,
LightSources -> {{{1., 0., 1.}, RGBColor[1, 0, 0]}, {{1., 1., 1.},
RGBColor[0, 1, 0]}, {{0., 1., 1.}, RGBColor[0, 0, 1]}}, Mesh -> True,
MeshStyle -> Automatic, Plot3Matrix -> Automatic, PlotLabel -> None,
PlotPoints -> 15, PlotRange -> Automatic, PlotRegion -> Automatic,
Prolog -> {}, Shading -> True, SphericalRegion -> False, Ticks -> Automatic,
ViewCenter -> Automatic, ViewPoint -> {1.3, -2.4, 2.},
ViewVertical -> {0., 0., 1.}, DefaultFont :> $DefaultFont,
DisplayFunction :> $DisplayFunction, FormatType :> $FormatType,
TextStyle :> $TextStyle}
Use the Help menu to learn more about each command.